What is JMeter? Why it is used?
The Apache JMeter is pure Java open
source software.
Which was first developed by
Stefano Mazzocchi of the Apache Software
Foundation, designed to load test functional behaviour and measure performance.
You can use JMeter to analyse
and measure the performance of web application or a variety of services.
Performance Testing means
testing a web application against heavy load, multiple and concurrent user
traffic.
JMeter originally is used for testing Web
Application or FTP application. Nowadays, it is used for a functional test,
database server test etc.
Open source license: JMeter is totally
free, allows developer use the source code for the development.
Friendly GUI: JMeter is extremely easy to use
and doesn't take time to get familiar with it.
Platform independent: JMeter is 100%
pure Java desktop application. So it can run on multiple platforms.
Full multithreading framework. JMeter allows
concurrent and simultaneous sampling of different functions by a separate
thread group.
Visualize Test Result: Test result can be displayed in a different format
such as chart, table, tree and log file
Easy installation: You just copy and run the *.bat
file to run JMeter. No installation needed.
Highly Extensible: You can write your own tests.
JMeter also supports visualization plugins allow you to extend your testing
Simulation: JMeter can simulate multiple
users with concurrent threads, create a heavy load against web application
under test
Support multi-protocol: JMeter does not
only support web application testing but also evaluate database server
performance. All basic protocols such as HTTP, JDBC, LDAP, SOAP, JMS, and FTP
are supported by JMeter
Record & Playback - Record the user activity on the browser
and simulate them in a web application using JMeter
Script Test: JMeter can be integrated with
Bean Shell & Selenium for
automated testing.
JMeter Elements: Thread Group, Samplers, Listeners,
Configuration
What is Element in JMeter?
The different components of
JMeter are called Elements. Each Element is designed for a specific purpose.
The figure below gives some
common elements in JMeter.
Here, we will discuss the
must-know components before we can start Testing in
JMeter.
Remaining components will be
discussed as when they are used in the succeeding tutorials. The elements
discussed in this tutorial are
Test Plan is where you add elements
required for your JMeter Test.
It stores all the elements (like Thread
Group, Timers etc) and their corresponding settings required to run your
desired Tests.
How to Use JMeter for Performance & Load Testing
Performance Testing is
crucial to determine that the web application under test will satisfy high load requirements. It can be used to analyse overall
server performance under heavy load.
JMeter can be used to test the
performance of both static resources such as JavaScript and
HTML, as well as dynamic resources, such as JSP, Servlets, and
AJAX.
JMeter can discover maximum
number of concurrent users that your website can handle
JMeter provides a variety of
graphical analyses of performance reports.
JMeter Performance Testing includes:
Load Testing: Modelling the expected usage by simulating multiple user access
the Web
services concurrently.
Stress Testing: Every web server has a maximum load capacity. When the
load goes beyond the limit, the web server starts responding slowly and produce
errors.
The purpose of the Stress Testing is
to find the maximum load the web server can handle.
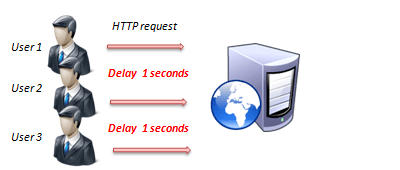
The figure below shows how JMeter
load Testing simulates the heavy load:
Create a Performance Test Plan
in JMeter
Before testing the performance
of target web application, we should determine-
Normal Load: Average number of users visit your website
Heavy Load: The maximum number of users visit your website
What is your target in
this test?
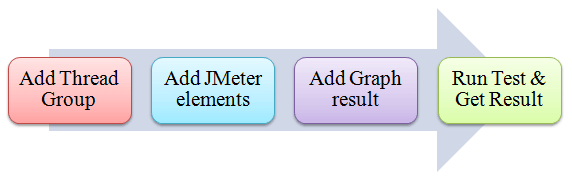
Here is the roadmap of
this practical example
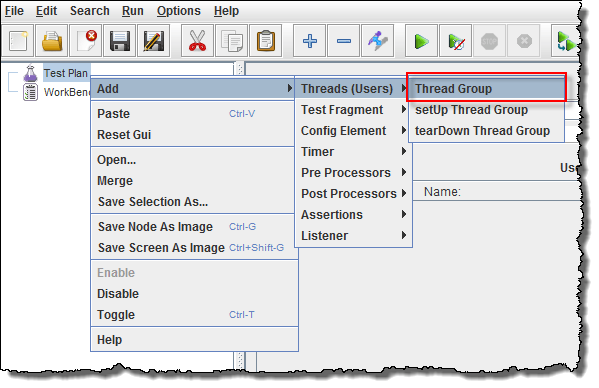
Select Test Plan on
the tree
Right click on the "Test
Plan" and add a new thread group: Add -> Threads (Users) -> Thread Group
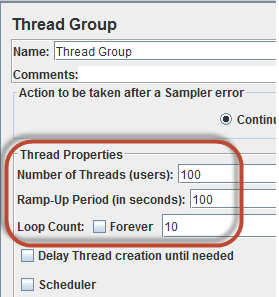
In the Thread Group control
panel, enter Thread Properties as follows:
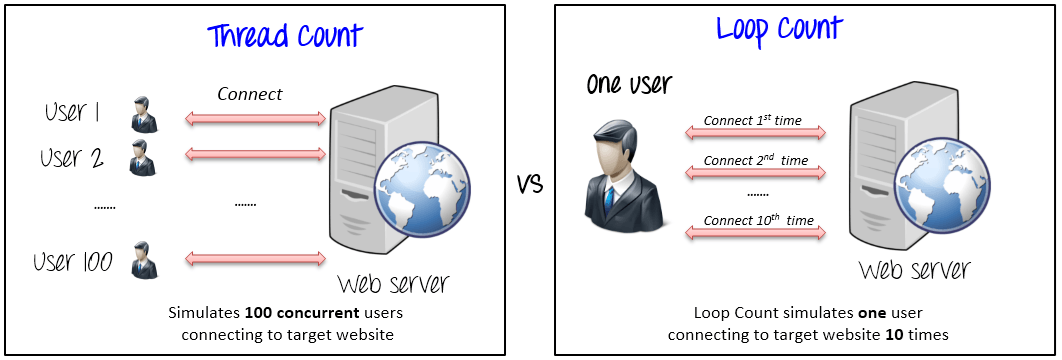
Number of Threads: 100 (Number of users connects to the target website:
100)
Loop Count: 10 (Number of time to execute testing)
The Thread Count and The Loop
Counts are different.
Ramp-Up Period tells JMeter how
long to delay before starting the next user.
For example, if we have 100 users and a
100-second Ramp-Up period, then the delay between starting users would be 1
second (100 seconds /100 users)
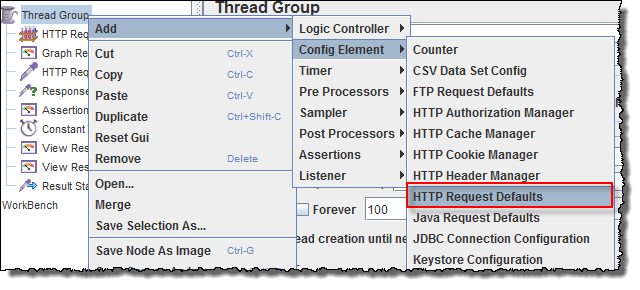
Step 2) Adding JMeter elements
This element can be added by
right-clicking on the Thread Group and selecting: Add -> Config Element -> HTTP
Request Defaults.
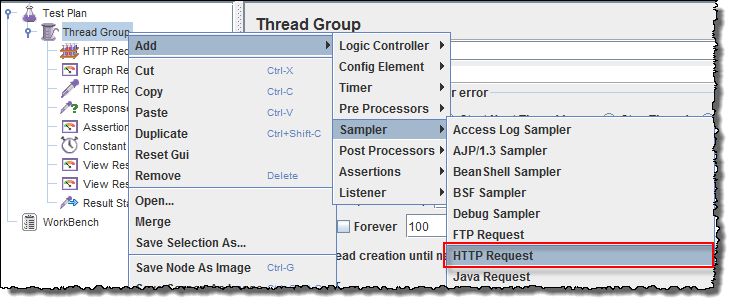
Right-click on Thread Group and
select: Add -> Sampler -> HTTP
Request.
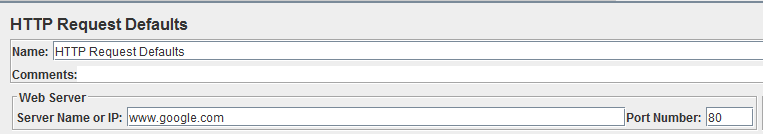
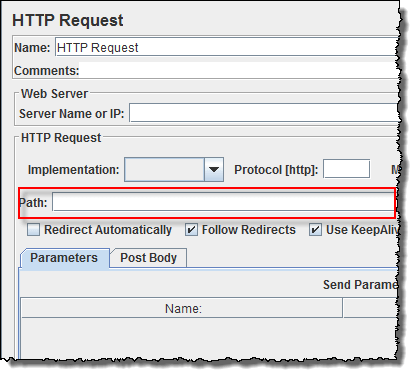
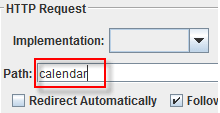
In HTTP Request Control Panel,
the Path field indicates which URL
request you want to send to
Google server.
If you keep the Path field blank JMeter
will create the URL request http://www.google.com to Google server.
In this test, you keep
the Path field blank to make JMeter create the URL request http://www.google.com to Google server.
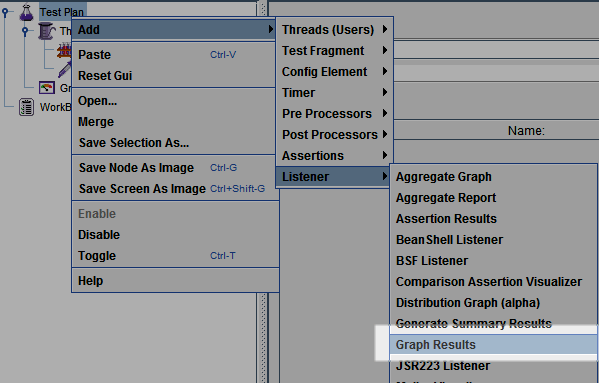
Step 3) Adding Graph result
JMeter can show the test result
in Graph format.
Right click Test Plan, Add -> Listener -> Graph
Results
Step 4) Run Test and get the
test result
Press the Run button (Ctrl + R) on the Toolbar to start the
software testing process. You will see the test result display on Graph in the
real time.
The picture below presents a
graph of a test plan, where we simulated 100 users who accessed on
website
At the bottom of the picture, there
are the following statistics, represented in colours:
Black: The total number of current
samples sent.
Blue: The current
average of all samples sent.
Red: The current
standard deviation.
Green: Throughput rate
that represents the number of requests per minute the server handled
To analyze the performance of the web
server under test, you should focus on 2 parameters
The Throughput is
the most important parameter. It represents the ability of the server to handle
a heavy load. The higher the Throughput is, the better is
the server performance.
JMeter Timers: Constant, Gaussian Random, Uniform
[Example]
By default, JMeter sends the
request without pausing between each request. In that case, JMeter
could overwhelm your test server by making too many requests in a
short amount of times.
The main goal of using timers is
simulating a virtual user’s “think time”. In the world of load testing, “think
time” stands for simulating real user behaviour which causes people to wait
between interactions with a web application.
Let imagine that you send thousands request
to a web server under test in a few seconds. This is what happens!
Timers allow JMeter to delay between
each request which a thread makes. A timer can solve the server overload problem.
Also, in real life visitors do not
arrive at a website all at the same time, but at different time intervals. So
Timer will help mimic the real-time behaviour.
Right-click Thread Group -> Timer -> Constant
Timer
Configuring Thread Delay of 5000
milliseconds
Advanced Load Testing Scenarios with JMeter:
Dynamic data is data that is
changed when information is updated. For example, session variables connected
to authentication mechanisms. This affects website recording, as JMeter needs
to know how to capture this dynamic data and reuse it in subsequent requests.
Otherwise, playing back the recording will show many errors.
This is where Correlations come
in. Correlations is the fetching of dynamic data from preceding requests and
posting it to subsequent requests.
Part 2 - Data-Driven Testing
and Assertions
When we run the same query over
and over again, the database doesn’t always build new queries, but reuses the
previous ones, to improve speed and optimize performance. This caching
obstructs our ability to test our scripts.
To avoid this problem, you can
incorporate a CSV file with different variables into the JMeter
test. The variables are defined in different columns, and these columns can
later be referenced in JMeter.
Here we are using the simple
Travel Agency demo we always use. The columns are the origin and destination
ports, and the rows are ports’ names.
To
incorporate the variables, add a CSV configuration element to the test.
Fill
in the Filename and the Variable Names, according to the number of columns you
have. In this demo we have two columns.
Go
back to the sampler and change the parameters names from specific to general
syntax. In this example, from London to ${toPort}.
Before
running the test, don’t forget to update the thread group. To make sure you are
going through all the rows, change the number of loops. Here, we have 5 rows in
our CSV file, so we go through 5 loops.
Now,
run the test to make sure it works.
Controllers in JMeter: Loop, Simple, Transaction, Module,
Random
What is the Logic Controller?
Logic Controllers let you define
the order of processing request in a Thread. It lets you control
"when" to send a user request to a web server. For example, you can
use Random Controllers to send HTTP requests to the server randomly
Logic Controllers
determine the order in which user request is executed.
Some commonly used Logic controllers
are below:
JMeter can record your testing steps; a
recording controller is a placeholder to store these recording steps.
Simple Controller is just
a container for user request.
Loop Controller makes the user
request run a specified number of
times or run forever as
shown in figure:
Random Controller makes all the
user requests run in the
random order in each loop
period.
For example, you have 3 user
requests to website in following order:
These 3 requests should run 5
times; Total 5 user requests will be sent to Google server by JMeter.
In sequential order,
requests are sent sequentially in following order:
HTTP request ->FTP
request->JDBC request
In random order,
requests are sent as randomly,
FTP request ->HTTP
request->JDBC request
JDBC request ->FTP
request->HTTP request
The goal of Module Controller is
to add modularity to JMeter.
The general idea is that web
applications consist of small units of functionality (i.e. Logon, Create
Account, Logoff...).
This functionality can be stored
in Simple
Controller as
"modules". Module Controller will choose which module needs to
run.
Consider the following scenario
-
You can use JMeter to create 3
modules. Each module simulates each user activity: Login, Logout, and Search.
The Module controller chooses
which module needs to run.
Other Important Controllers:
Interleave Controller: picks up and makes one of
user request run in each loop of the thread.
Runtime Controller: controls how long its
children are allowed to run.
For example, if you specified
Runtime Controller 10 seconds, JMeter will run your test for 10 seconds.
Transaction Controller: measures the overall time taken
to finish a test execution
Include Controller: is designed to use an external test plan.
This controller allows you to use multiple test plans in JMeter. See detail
in JMeter Performance Testing.
This section shows you
step-by-step instruction to add Loop Controller set
to your current performance test plan.
The Loop Controller makes the
samplers run as a certain number of times, in addition to the loop value you
specified for the Thread Group. For example, if you
Add one HTTP Request to a Loop
Controller with a loop count 50
Configure the Thread Group loop
count to 2
Then, JMeter will send a total
of 50 * 2 = 100 HTTP Requests.
This is the roadmap of
this example:
Step 1) Configuring Thread Group
Right click on the Test Plan and add a new thread group: Add-> Threads (Users) ->Thread Group
But in Thread Group control panel, enter Thread Properties as follows:
It will make one user request to the web server google.com and run
it 2 times.
Add HTTP request default to www.google.com.
Right Click Thread Group -> Logic Controller -> Loop Controller
Step 2) Configuring Loop
Controller
Add value 50 to Loop Count field
as below figure. It will make one user request to the web server google.com run it 50 times, in
addition to the loop value =2, you specified for the Thread Group above.So
JMeter will send a total of 2 *
50 = 100 HTTP Requests.
Right click Loop Controller, Add
-> Sampler -> HTTP request
How to Perform Distributed
Testing in JMeter:
If you have an e-commerce site
(or any site for that matter), it’s not uncommon that you would expect a higher
level of traffic on certain days, like Black Friday for
example. At moments like these, we need to take our load tests to the next
level and simulate larger numbers of concurrent users. If we are running our
load tests locally with Apache JMeter™,
there are certain limitations to the number of users you can run, even if your
computer has enough CPU and memory.
How can we create a scenario
with more than 800 concurrent users using JMeter? One of the
answers is running JMeter in distributed mode. For those of you
who have never heard about it, here is a brief explanation.
When we talk about distributing
JMeter, we refer to a Master-Slave architecture where JMeter uses Java RMI
[Remote Method Invocation] to interact with objects in a distributed network.
You can see this in the image below.
Distributed testing enables
having a local JMeter (master) that handles the test execution, together with
multiple remote JMeter instances (slaves) that will send the request to our target
server.
But before being able to run
JMeter in a distributed way, there are a couple of simple steps you must
perform.
First, we need to have multiple
computers.
Then we need to get the JMeter
Server running on each slave system that we have. For that purpose we have to
execute the jmeter-server.bat (jmeter-server for unix users) that is located in the jmeter/bin. Once we run it we should see something like this:
Functional Testing with JMeter:
x
JMeter was originally built to
provide an open source solution for load and performance testing. However,
JMeter can also be used to perform functionality tests on an application’s
backend. For example: with JMeter, you can test part of your user registration
functionality by testing your
system’s APIs and verifying that users are successfully created
within your database. Instead of opening a browser and manually entering random
data in the provided fields, you can use JMeter to generate an API call with
different user names and passwords.
RESTful APIs generally use the
GET or POST (with a payload) method of HTTP requests, and either generate properties
files from POST requests or JSON files that represent data that you want to
move over. Functional testing can be performed with JMeter quite easily, by
using a dedicated HTTP or HTTPS
sampler. A request sample can be created from data in a tested
application - and an external file is then used to provide the different parameters
that you’d like to test.
You can also use assertions to
configure functional testing in JMeter. Assertions identify if a reply was
received from an API, indicating whether the desired data was received or if a
process failed. For example: when testing successful user registration, a reply
would indicate whether or not a user ID was created.
JMeter can also be used to
perform Java unit testing with JUnit. JUnit is natively supported in JMeter,
and can be incorporated as part of your overall functional testing strategy. If
any JUnit tests were created during software development, they can also be
incorporated as part of your testing process. JUnit tests can be used in
addition to API calls.

.png)
.png)
.png)